Where the water comes from: inlet locations and catchment areas (Part 2)
Part 1 ended with a drainage map: where water flows on the terrain, and where it collects. But a drainage map isn't an answer to the real question yet. The question is per plant: how much land drains into SMUD's turbine? And that question has a nasty setup problem hiding inside it, because the points we have for each plant are in the wrong place to measure a catchment.
This post solves two things. First: where is each plant's inlet — the point in the landscape that actually marks "water entering this plant's system"? Second: given that inlet, what is the catchment area — the land whose water ends up there? Each plant, in order, with the numbers we get.
The inlet problem: the plant point is not the inlet
Part 1 got each plant from CEC's open data. Those points are the powerhouse locations — on the valley floor, where the pipe exits and the water hits the river again. That is the outlet, not the inlet.
A hydro plant is a pipe. Water enters the top (the forebay, usually a reservoir held back by a dam), falls through the pipe, and pushes the turbine at the bottom. The inlet is the forebay; the outlet is the powerhouse. And the catchment we care about — the land that feeds this plant — is the catchment of the forebay, not of the powerhouse point.
That distinction matters a lot, because the two points can be kilometers apart and at wildly different elevations. Look at the numbers:
| Plant | Outlet (powerhouse) elev. | Inlet (forebay) elev. | Drop |
|---|---|---|---|
| Jaybird | 939 m | 1344 m | ~386 m |
| White Rock | 321 m | 526 m | ~286 m |
| Jones Fork | 1489 m | 1664 m | ~175 m |
| Robbs Peak | 1476 m | 1588 m | ~118 m |
| Union Valley | 1382 m | 1476 m | ~102 m |
Jaybird's powerhouse and its forebay are ~386 m apart in elevation and a good distance apart in distance. If we measured a catchment at the powerhouse, we'd be measuring the wrong watershed — the big downstream one — and we'd be wrong about the land feeding Jaybird.
Three of the records point at the wrong dam
There's a second wrinkle. Three of SMUD's records are powerhouses only — the CEC row is for a turbine, and its "dam" is actually a feeder reservoir a few kilometers upstream on a tributary. So the inlet for those isn't at the plant site at all. We have to remap them:
- Jaybird (the CEC powerhouse) is fed by Junction reservoir.
- Jones Fork is fed by Ice House reservoir.
- White Rock is fed by Slab Creek reservoir.
(White Rock and Slab Creek are the same feeder reservoir — the two plants share one forebay.)
So the real inlet list, per plant, is:
| Plant | Inlet = forebay |
|---|---|
| Camino | Camino dam |
| Jaybird | Junction dam |
| Jones Fork | Ice House dam |
| Loon Lake | Loon Lake dam |
| Robbs Peak | Robbs Peak dam |
| Slab Creek | Slab Creek dam |
| White Rock | Slab Creek dam (shared) |
| Union Valley | Union Valley dam |
| Chili Bar | no forebay — see below |
Each inlet is a dam crest (the top of the dam that holds the reservoir). We consolidated those crest coordinates from the CEC/CalSim3 records and verified them against the DEM — 12 dams, all within a few meters of the surveyed crest elevation.
Snapping the inlet onto the stream
A dam crest is a point on the terrain, not a point on the water network. To anchor a catchment, we need the inlet to sit on the derived stream network — specifically, at the spot where the forebay's water enters the channel. Two sub-cases:
Case 1 — the crest is above a mapped lake. Most of these forebays are reservoirs, and the USGS NHD dataset maps them as lake polygons. The inlet is where the lake drains — the first stream cell on the flow path that lies outside the lake polygon. This is the lake outflow.
This one is the trap. The obvious rule is "follow the flow downhill from the crest and stop at the first point that's lower." But a lake's surface is flat — the outflow is at essentially the same elevation as the crest. So "first lower point" walks right past the outflow and lands on some cell downstream, off the actual channel. The fix is to search by lake membership (inside the lake polygon vs. not), not by elevation drop.
Case 2 — no lake, just a flat hilltop. For a forebay that isn't a mapped reservoir, the inlet is the first stream cell on the flow path below the crest's elevation. Note "stream" is doing work there: if we just take "first lower cell" we can land on a bare slope cell next to the channel, not on the channel itself.
Both cases use the same Barnes pour-graph flow path from Part 1, so the inlet sits on the same flow network that drew the streams. Every inlet is verified to be an on-stream cell, and we keep the stream threshold low enough (0.5 km²) that the "first stream cell below the crest" is the creek the forebay actually pours into — not the main stem a kilometer downhill.
Chili Bar: run-of-river, and why it still has a catchment
Chili Bar is the exception. It's run-of-river — no dam, no reservoir, the turbine sits right in the stream. There's no forebay to anchor. Its inlet is just the plant's stream point, and its catchment is the upstream flow accumulation at that point: the water that flows past the turbine.
This is a distinction worth being careful about, because it's easy to get wrong. "No forebay" does not mean "no catchment." A run-of-river plant has a perfectly well-defined catchment — it's the watershed upstream of its point on the river. It's the smallest sensible definition (water actually through the turbine), not zero.
Catchment areas: walk the flow backwards
Now each plant has an inlet on the stream network. The catchment is: every cell that eventually flows, following the network, into that inlet.
On the Part 1 Barnes flow graph this is a clean operation. Each cell knows which neighbor it drains to. Reverse the arrows, and do a breadth-first search upstream from the inlet cell. Every cell we reach is part of the catchment. Count the cells, multiply by the cell area (30 m × 30 m = 900 m²), and that's the catchment area.
Two details make this work that would bite you if you missed them:
Flat reservoirs need a multi-source seed. If you seed the upstream walk from a single inlet cell sitting on a flat lake surface, the walk barely goes anywhere — the flat surface routes almost no upstream cells into that one cell. The result is a near-zero catchment (Jones Fork came out 0.6 km² instead of 69). The fix: for a lake forebay, seed the walk from all the lake cells within ~2 km of the crest, not just the inlet cell. The non-lake forebays stay single-cell.
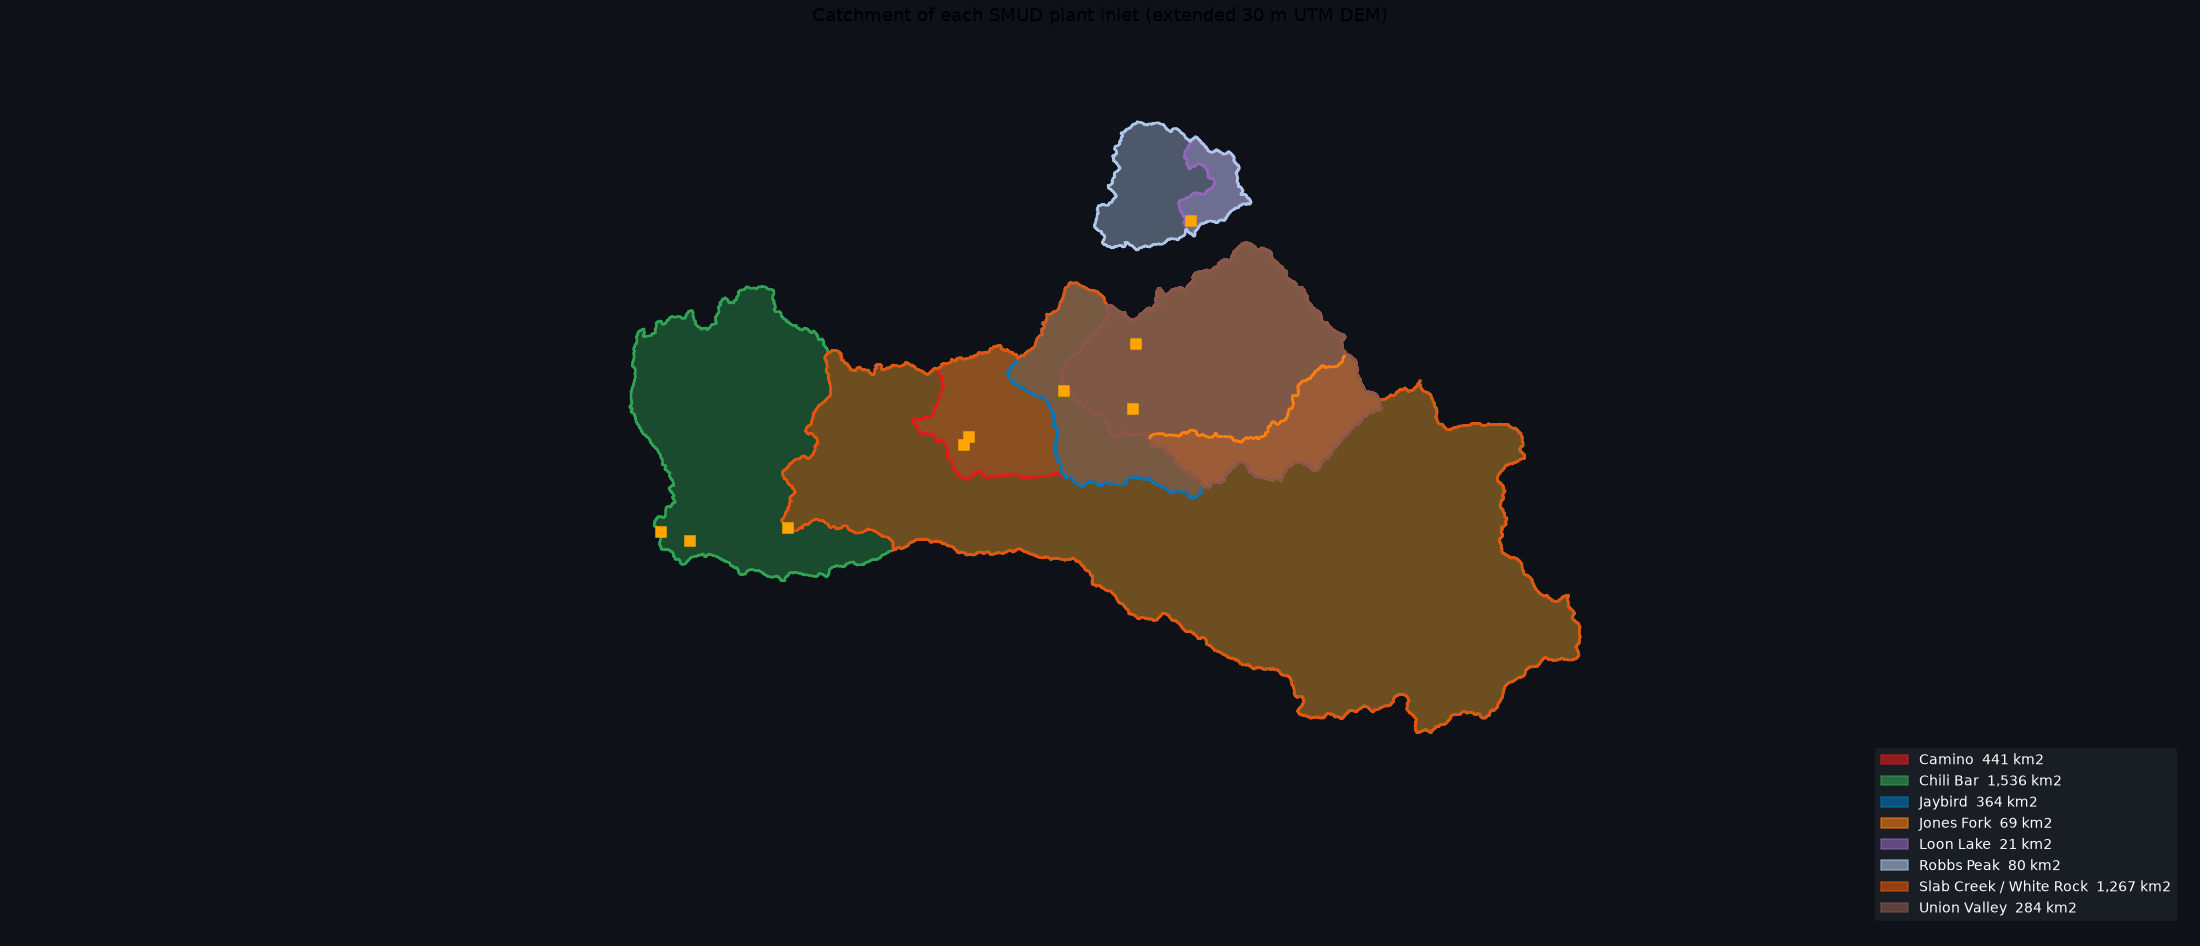
Basins are nested, so the deliverable is interactive. The Feather corridor is a long river with several plants on it, and their basins nest: the downstream plant's catchment contains the upstream plants' catchments. So a static map with all the polygons painted opaquely just smears — the big downstream basin covers the small upstream ones. Instead of a flat PNG, the deliverable is a self-contained interactive map: one toggleable layer per inlet, so you can turn basins on and off and see the nesting. (Open the catchment map → — the overview image below is a supplement, not the real thing.)
Each toggle row also carries a marker for the plant with its catchment area, so the map doubles as the per-plant summary. And there's a shaded gold band where you'll notice the map goes quiet — the stretch of Sierra crest on which no plant's catchment reaches. Water there leaves the grid (mostly west, some north) without passing an intake, which is exactly the kind of thing the map makes visible by not being there.
The results
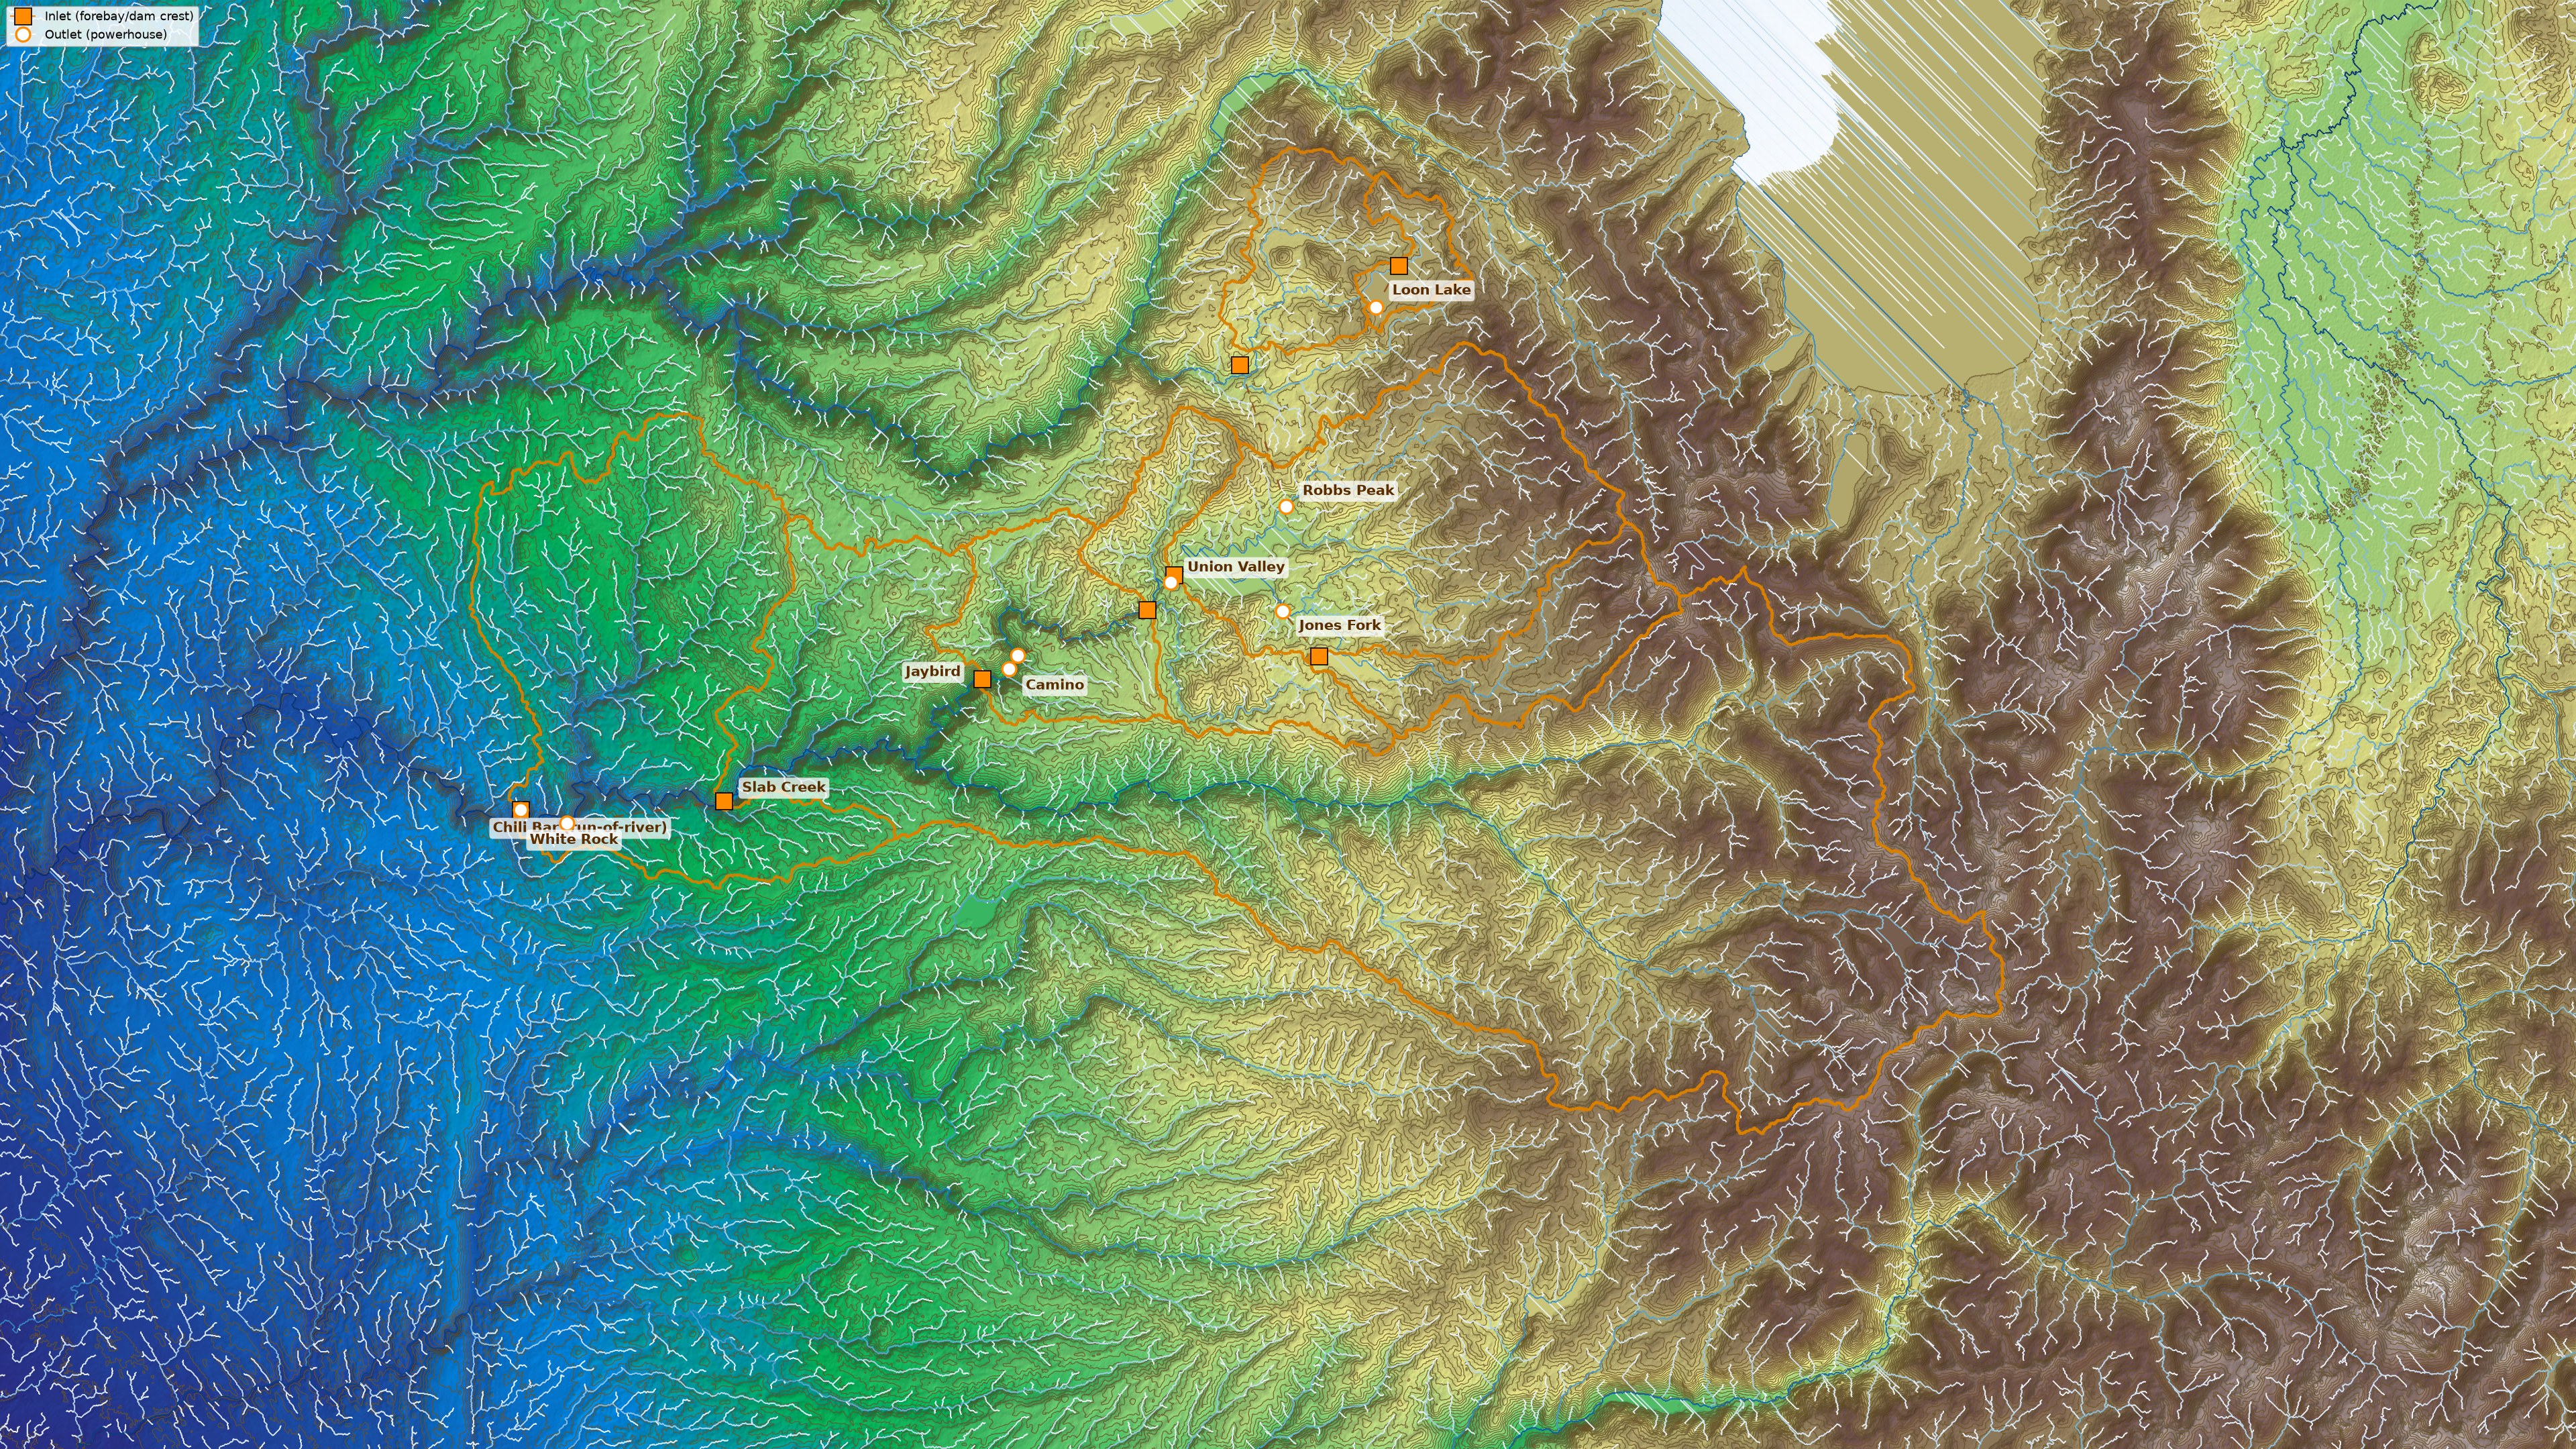
The full picture in one frame: terrain (elevation gradient, shaded, contours every 50 m), the Barnes flow-network streams (light headwaters to deep-blue main stem), every catchment's boundary, and — the new layer — each plant's inlet (orange square, the forebay/dam crest) and outlet (orange circle, the powerhouse), joined by the line the water actually travels. Note the two watersheds: Loon Lake and Robbs Peak drain into the North Fork Feather, while the other six plants sit on the mainstem — separate river systems that join below the map.
Catchment areas, per plant, on the 30 m DEM, inlet-anchored:
| Plant | Forebay | Catchment (km²) |
|---|---|---|
| Chili Bar | run-of-river | 1535.5 |
| Slab Creek / White Rock | Slab Creek | 1266.5 |
| Camino | Camino | 441.3 |
| Jaybird | Junction | 364.0 |
| Union Valley | Union Valley | 283.6 |
| Robbs Peak | Robbs Peak | 79.7 |
| Jones Fork | Ice House | 69.3 |
| Loon Lake | Loon Lake | 20.8 |
A few things to notice:
- Chili Bar is the biggest (1535 km²), and it's run-of-river — it collects everything upstream of its point on the Feather. That's the payoff for "no forebay, but still a catchment."
- Slab Creek and White Rock are one number, not two — they share the Slab Creek forebay, so their catchment is shared, not additive.
- Loon Lake is the smallest (20.8 km²): it's high in the mountains, near the headwaters, so it collects only a little land.
- The areas roughly track where the plants sit: headwater plants small, low river plants big.
Two watersheds, one map
One last thing the map makes visible: the basins split into two watersheds. Loon Lake and Robbs Peak are in the high country and drain to the North Fork Feather, while the other six plants are on the mainstem Feather. The two river systems join well below the map, so those two small north-country catchments have no business with the six downstream numbers at all.
Caveats, stated plainly
- 30 m resolution is the limit. A cell is 900 m²; a catchment that's a cell or two across a ridge is at the edge of what this grid can resolve. Loon Lake's 20.8 is near that floor.
- Areas are grid-derived, not surveyed. They agree with the terrain and with the mapped lakes/streams, but they're not a land survey.
- Run-of-river vs. reservoir are different definitions. Chili Bar's number is "water through the turbine"; the reservoir plants' numbers are "land draining into the forebay." They're the right definitions for each plant, but they're not the same kind of number.
- The grid truncates at its edge. A basin that runs off the east edge of the DEM is reported as a lower bound — that's why we extended the DEM eastward (Slab Creek's number grew from ~993 to 1266 km² once the full basin was inside the grid).
What's next
Part 3 is the tool to browse all of this: the interactive Watershed Explorer — click any stream on the map and its catchment is computed live. After that, the energy math: now that we know how much land feeds each plant, the next question is how much energy does each cubic meter of that water make — head (the inlet-to-outlet drop computed above) times turbine efficiency. Then we translate precipitation and snowpack (SWE) into volume through the plant, convert the IDSS forecast gridpoints into total water, and build the hypsometric curve for each catchment — how snow readings at different elevations sum to a total. The final post ties it into a rough dollar value at CAISO NP-15 block-contract pricing, with the caveats that keep it honest.